Guide to Analyzing Limestone Samples
The Canstrat guide to analyzing sandstone samples is a repeatable process that will help insure the geologist does not miss any important characteristics of the rock. Users of this guide should note this is not a replacement for hands on training with an experienced geologist in drill cutting sample analysis. Observing drill cuttings through a microscope is a practiced skill and requires a solid foundation of geology to be successful.
Learn how to use the Canstrat Method on real world samples.
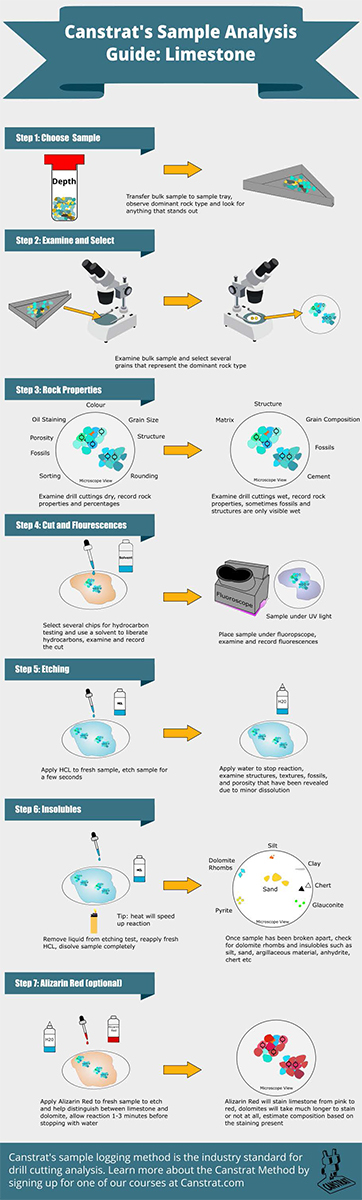
Step 1: Observe bulk sample
The first step is to observe the bulk sample in the tray without a microscope or at very low magnification. Key features can be picked out before detailed examination begins which can help with further analysis.
- What is the colour of the sample?
- What is the sample made up of? I.e. shales, sands, silts, carbonates, lost circular material?
- Does the sample smell of petroleum?
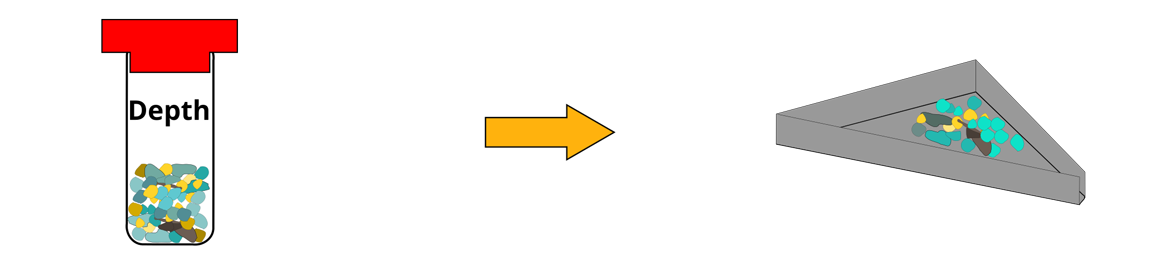
Another very effective way to do this is to have several samples in a 5 or 10 compartment sample tray. In the sample below there is a gradual increase in sand and silt grains going from left to right. Even before this sample goes under the microscope the geologist will know to expect more sand than silt. Do not use too much sample, a teaspoon is plenty to observe the sample correctly.
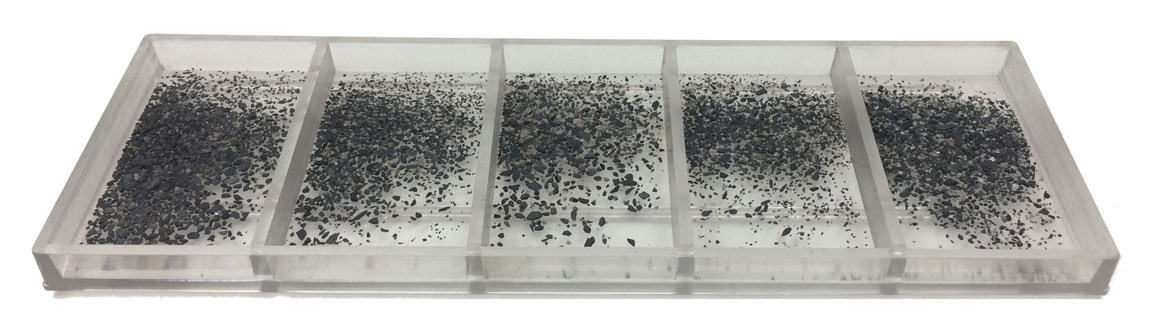
Step 2: Examine and Select
For proper analysis it is vitally important the geologist be able to recognize the dominant rock type in the sample. On two watch glasses place several grains of the dominant rock type for testing. Select one of the watch glasses to begin detailed analysis of the sample. 2-2.5x magnification is the recommended setting for the first pass of a sample. Increasing the magnification gradually is necessary to examine some features in more detail such as structure and fossil content.
Step 3: Record Rock Properties
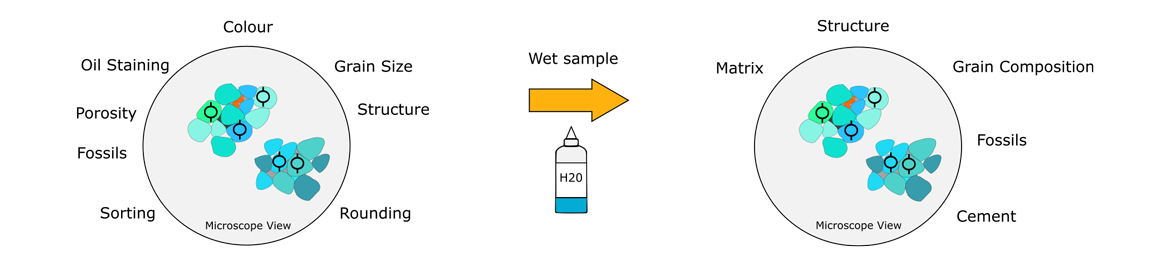
Begin by examining the sample dry for the following properties: colour, grain size, rounding and sorting, porosity, textures, and oil staining. Wetting the sample with a sufficient amount of water to cover the sample is necessary to successfully observe the following properties: matrix, structures, grain composition, fossil material, and cement. In limestones fossil content will more than likely become visible after the sample is wet.
Once all the properties have been recorded dab the sample with some tissue paper to absorb as much water as possible without the drill cuttings becoming stuck on the tissue paper. Place the sample aside for further examination.
Grainsize cards are an excellent way to help with determining grain size, rounding and sorting.
Step 4: Cut and Fluorescence
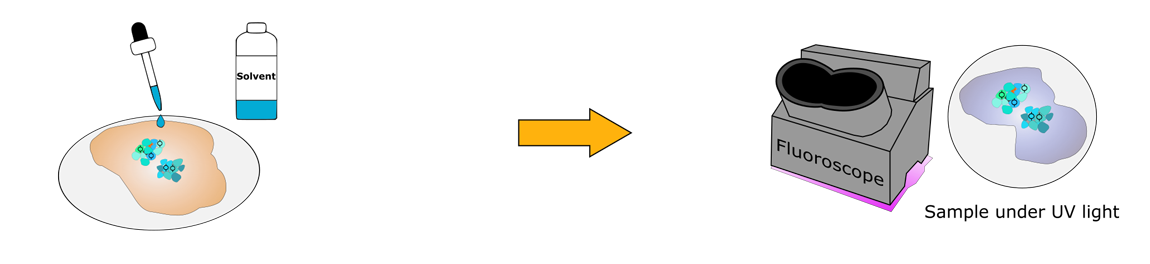
Grab the dry watch glass sample and place several grains into a spot plate if available or keep them in the watch glass.
Look at the sample dry under UV light and record the dry fluorescence colour and its distribution such as rare, spotty, even etc. Fluorescence will appear due to oil staining on the surface of grains, sometimes minerals or fossils present will also fluoresce.
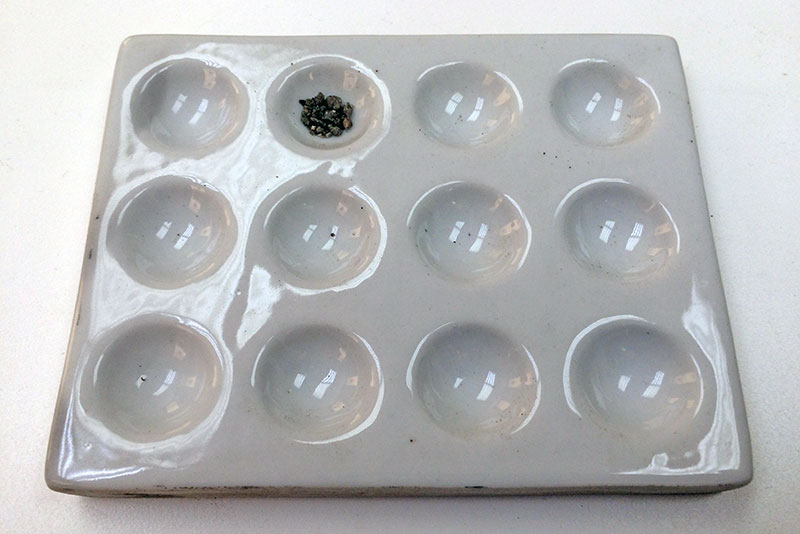
This example shows spotted yellowish orange dry fluorescence.
Apply solvent to the sample and record the cut. Generally cut is recorded as dark, medium, light and clear, from the colour of the solvent. In this example, you can see a medium cut forming a ring in the spot plate as the solvent evaporates around the grains being tested.
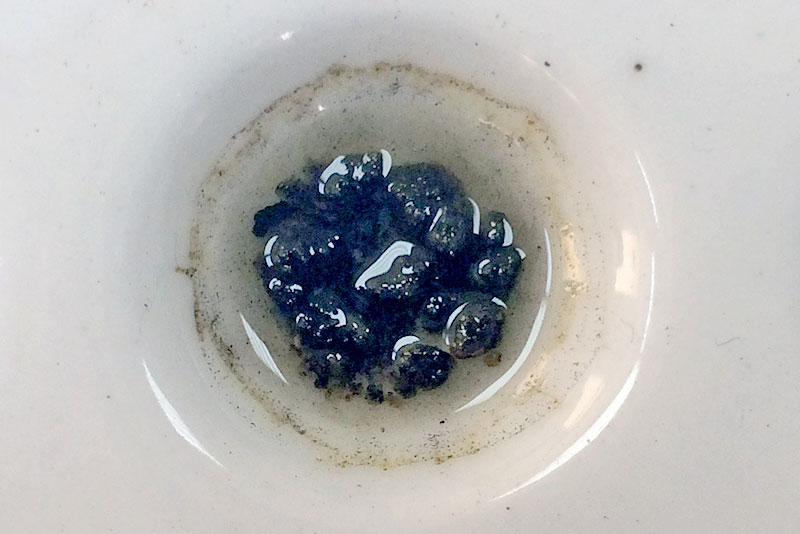
Fluorescence is recognized as the solvent fluid colour change under black light due to UV reactions with the hydrocarbons present. Record if the fluorescence is poor, fair, or good. Also record the nature of the fluorescence such as slow, streaming, and instant.
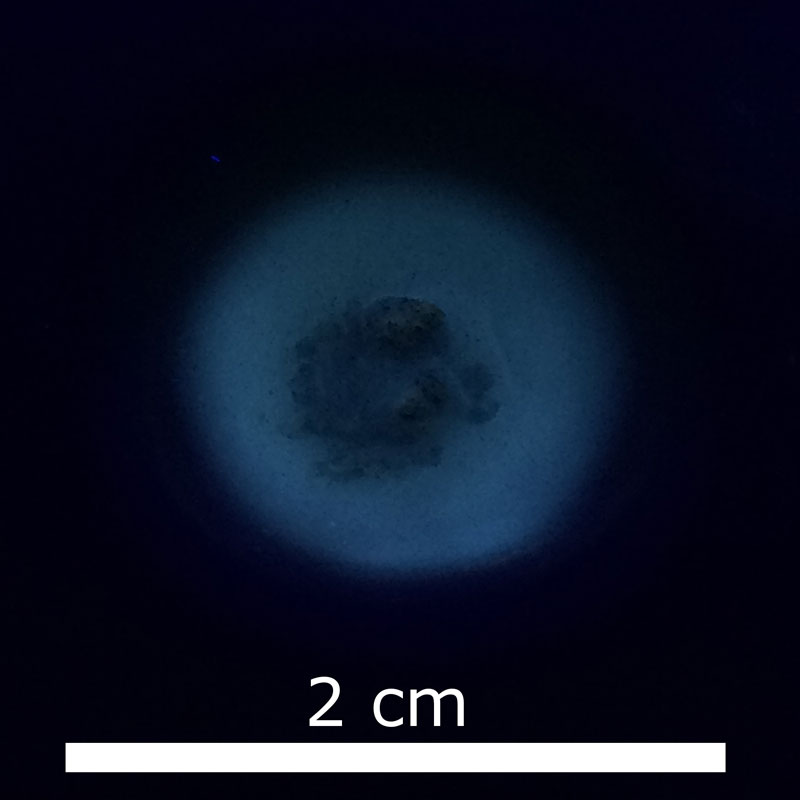
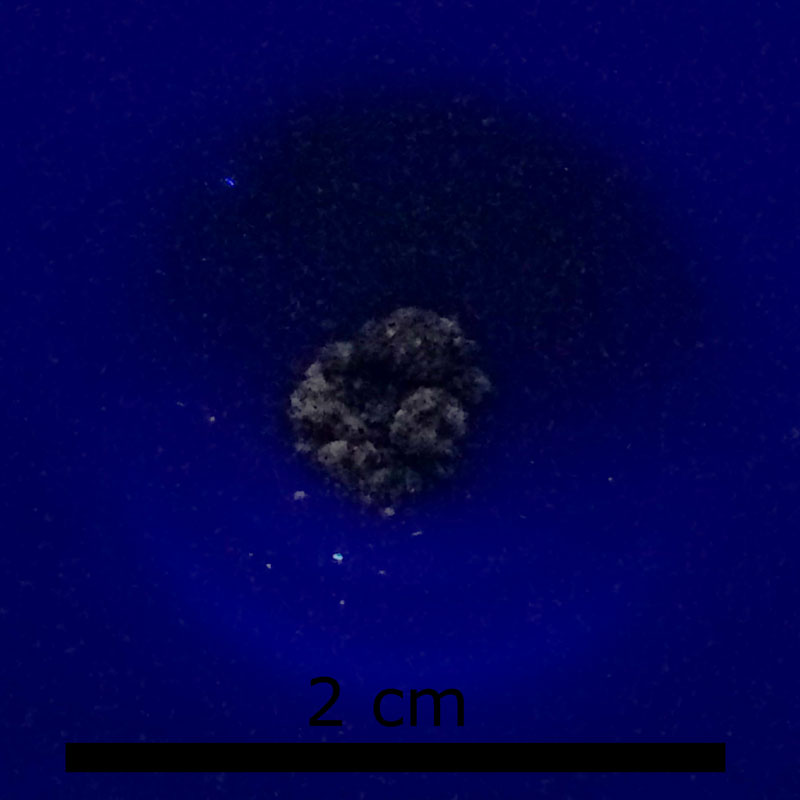
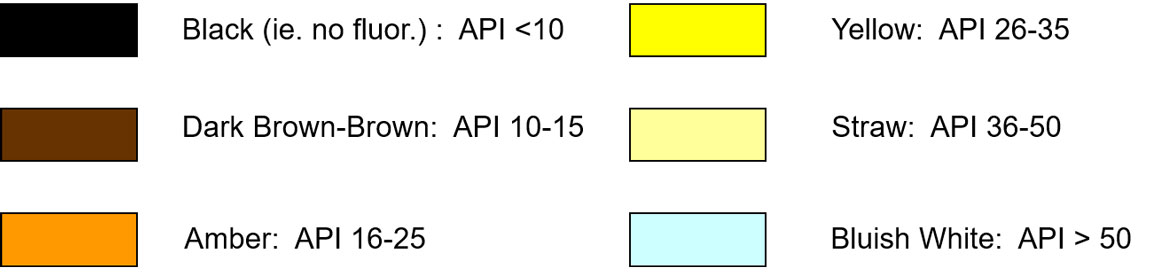
This sample would be described as instant good bluish white fluorescence. Colour can give an indication to the api of hydrocarbons present.
If the sample shows fluorescence but does not produce a cut or liquid fluorescence when solvent is applied it may just be the minerals or fossils present giving you a false positive.
Step 5: Etching

The goal of etching is to dissolve a small amount of surface area of the grains to reveal structures, porosity, fossils or anything that is not apparently visible on the surface. Applying a few drops of 10% concentration HCL will cause the limestone to effervesce. After allowing the reaction to proceed for a few seconds further apply water to dilute the HCL and stop the reaction. Examine the dissolved surfaces of the grains and look "inside" them. If dolomite is present, etching will cause grain relief or dolomite rhombs to drop out of the sample. Use the amount of rhombs to estimate the percentage of dolomite present. Finally re-examine the rock properties recorded in step three.
Step 6: Insolubles
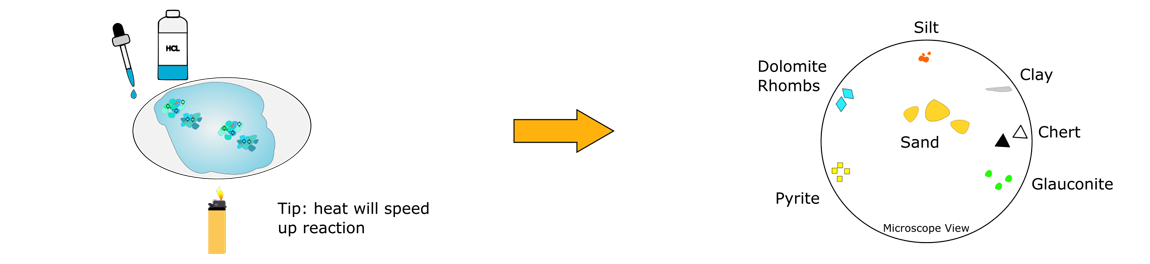
To examine the insolubles present, the sample must be completely dissolved. Remove the liquid from the etching test and re-apply 10% HCL, furthermore heat the sample to speed up the reaction. Once the reaction has stopped examine the insoluble residue.
Step 7: Alizarin Red (optional)
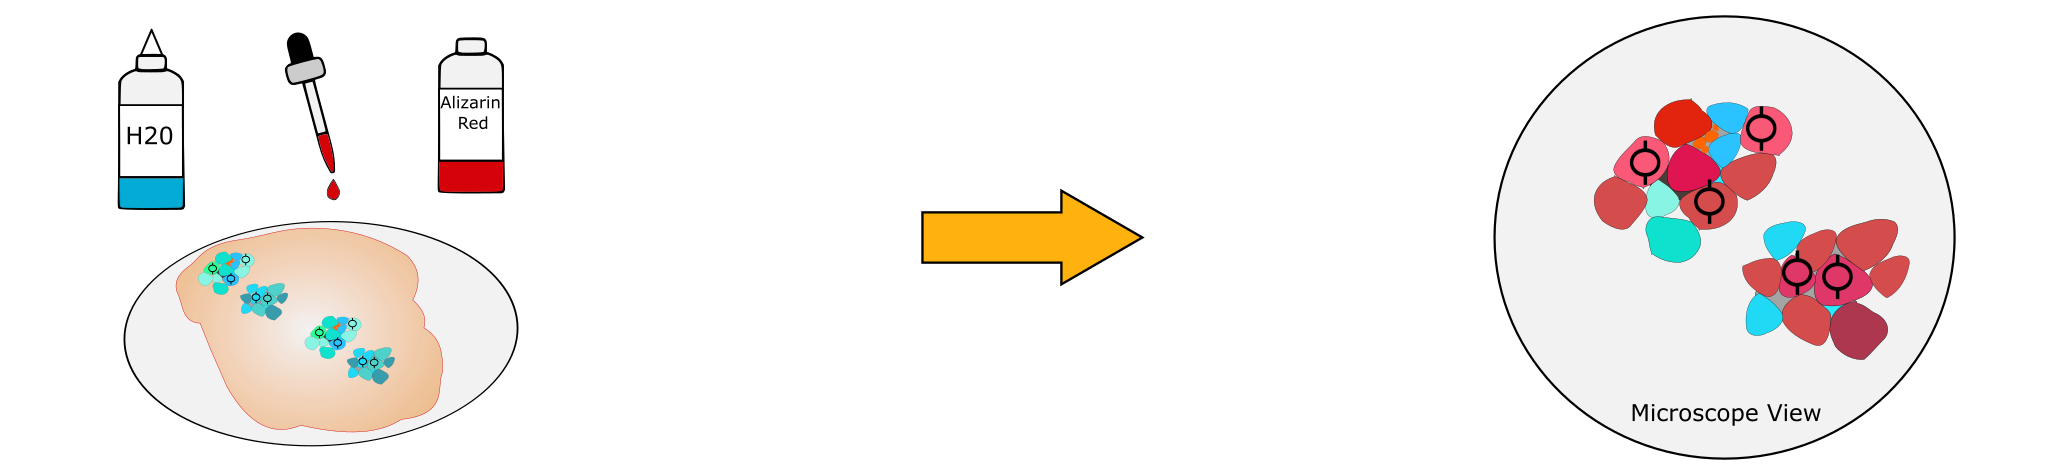
Applying Alizarin red is an optional last step which can help with limestone vs dolomite estimation. Alizarin red solutions contain a dilute amount of acid that will react with carbonates, this reaction allows the Alizarin dye to stain carbonates from pink to red. Dolomite will take much longer to stain or no obvious change will be visible.
After allowing the reaction to proceed for 1-3 minutes dilute the solution with water and observe the staining to estimate the amount of limestone and dolomite in the sample.
By following these steps repeatedly and accurately all the important information for limestone drill cuttings will be captured. For information on how to analyze shale, limestone, dolomite, anhydrite and siltstone check out our learning center.
To download a quick reference guide and sign up for our monthly newsletter click the image below.